Obstacles for international mobility: an exploration of the Eurostudent VII microdata
Eurostudent VII Microdata
In the latest, seventh EUROSTUDENT round , data from (up to this point) 13 countries has been harmonised and combined in a Scientific Use File (SUF)[1] . In previous rounds, only aggregated data was available for further analyses. With this comparable micro-data set on the social dimension of European higher education, researchers can now use more advanced statistical methods to analyse the life of European students in higher education, in which a wide range of students’ social and economic conditions are covered. This allows researchers to draw more sound conclusions and create a better understanding of the interrelationship between variables (for instance with multivariate analyses) and cross-national differences in students’ experiences, attitudes and transitions.
The EUROSTUDENT VII data has been collected in 2019 and 2020. The SUF currently contains data from the countries listed below. These countries have a collective sample size of around 140,000 students. Data from more countries are scheduled to be added to the SUF by early 2022.
- Austria
- Croatia
- Denmark
- Estonia
- Georgia
- Ireland
- Hungary
- Lithuania
- Luxembourg
- the Netherlands
- Norway
- Poland
- Slovenia
Since there are numerous topics covered in the questionnaire, the SUF is suitable for various possible analyses regarding European higher education students on topics such as students’ parental socio-economic position, study conditions and experiences, income and expenses, living conditions and international mobility.
Obstacles for international mobility
For this blog post we have looked into students’ international mobility and the obstacles students experience for going abroad, and specifically how these potential obstacles are related to one another. The following potential obstacles were listed in a question where students could enter whether the listed obstacle is a ‘big obstacle’ or ‘no obstacle’ or something in between (on a 5-point scale) for going abroad. These questions were asked among all students, meaning students who have gone abroad but also those who did not.
The listed potential obstacles:
- Insufficient skills in foreign language
- Lack of information provided by higher education institution
- Separation from partner, child(ren)
- Separation from social circle (friends, parents, etc.)
- Additional financial burden
- Loss of paid job
- Lack of motivation
- Low benefit for studies at home
- Difficult integration of enrolment abroad into the structure of home study programme
- Problems with recognition of results achieved abroad
- Health/disability
By making use of an explorative factor analysis, we have looked into how these different obstacles are interconnected. This reduces the dimensions of obstacles of going abroad, making it easier to compare countries. In a first step, we investigated the interrelations between all variables (items), and how each item contributes to the latent score of ‘obstacles’. It appears that the following items are not related to other variables:
- Insufficient skills in foreign language
- Additional financial burden
- Loss of paid job
- Health/disability
- Lack of motivation
Although the ‘fear of losing a paid job’ and not wanting an ‘additional financial burden’ are somewhat related, the relationship between these indicators is not sufficient to justify a separate factor.
With the other items we have performed an additional separate factor analysis. The outcome is that we can identify two different factors underlying the items. In the following table, for each of these two factors the (rotated) score of an individual variable on this factor is shown; the higher this score is, the more it determines the latent score. This means that for the first factor, the ‘problems with recognition’ and ‘difficulty integrating it into the study programme’ are more important for the first factor, whereas the ‘lack of information by the HEI’ is the least important variable for the first factor score.
Table 1: Factor loadings (oblique rotation) for obstacles in social mobility
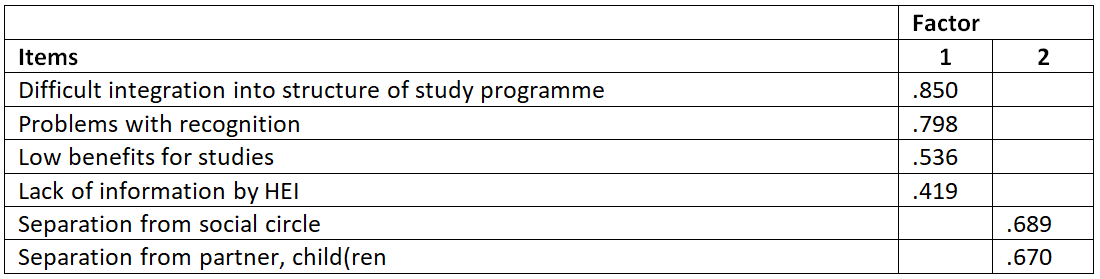
From a content perspective, we can identify these two factors as being practical objections (for the first factor) and having social objections (for the second one). The correlation between these two factors is 0.321.
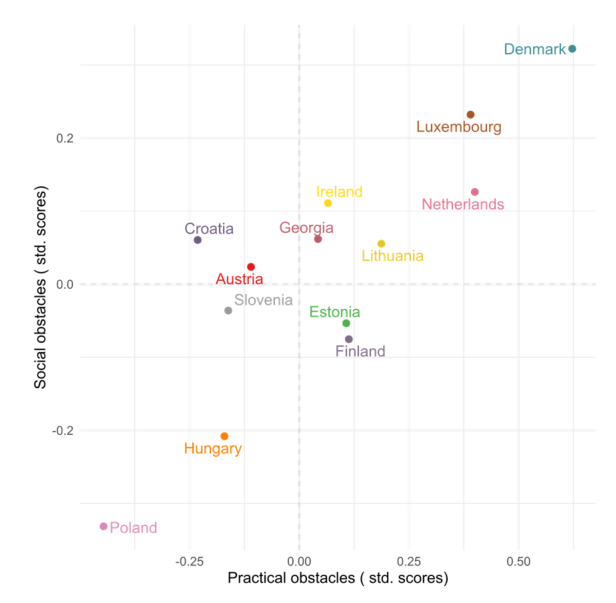
When looking at the different means of these factor scores for each country (see the figure below) four segments can be identified: countries with a low level of both practical and social obstacles (top-right), countries with less practical obstacles and more social obstacles (bottom-right: Estonia and Finland), countries with more practical obstacles and to a lesser amount social obstacles (top-left: Croatia and Austria) and countries with a high level of both practical and social obstacles (bottom-left: Slovenia, Hungary and Poland).
Figure 1: Average scores on social and practical obstacles for social mobility per country
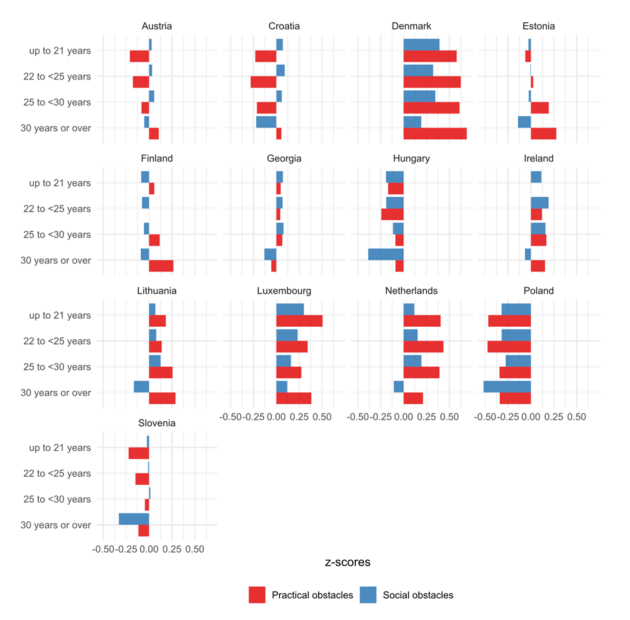
When taking students’ age into account, we can see different patterns for separate countries. For some, we see that older students, on average, experience less practical obstacles, such as Austria, Croatia, Estonia, Finland, Lithuania and Slovenia. For other countries, no or little differences regarding age in relation to experiencing practical obstacles are found. For social obstacles there is a clear difference for most countries between the oldest students (30 years or over) and other students when it comes to experiencing social obstacles. This is the case for all countries except Finland.
This blogpost demonstrated some of the possibilities you can do with the Eurostudent VII microdata. In this example, distinguishing between different types of obstacles for international mobility can be helpful in developing policies to increase international mobility; for instance, practical obstacles seem to be more easily mitigated than social obstacles by policy measures However, many questions can arise from this brief analysis, such as to what effect individual characteristics such as having children, gender, age, socioeconomic background are at play here. We invite you to do further analyses on this topic and others and to explore the SUF yourself. Any interested researcher can do so by applying for the Scientific Use File with the following link.
[1] Not all countries are able to deposit their EUROSTUDENT micro data due to legal obstacles.